Animated charts in videos clearly present accurate data and highlight trends at a glance. This post demonstrates how to add a chart to videos using VSDC and Filmora, helping you make your video more informative and professional.
Applying a moving chart to videos is a unique way to show dynamic changes over a specific period. To improve your editing efficiency, this post introduces 2 reliable graph video makers to add a chart to videos with ease. Let’s get started!
Why Add a Chart to Videos
Before diving into the methods, it’s essential to understand why adding charts to videos is beneficial. Compared with static numbers or plain text, animated charts in videos are more intuitive and engaging to present data. They can help viewers quickly grasp trends and key insights, making complex information easier to understand and improving data readability.
How to Add a Chart to Videos Using VSDC
VSDC is a versatile video editor widely recognized for its non-linear editing capabilities and broad support for video formats and codecs. It enables you to edit 360 videos and layer clips, audio, and effects without rigid sequencing, making it an ideal choice for complex edits. In addition, built-in tools such as voice-over and green background removal features also make it excellent for creating professional-level videos.
When it comes to adding a chart to videos, VSDC delivers strong performance. It offers a wide array of chart styles, including pie, bar, line, and more, allowing you to choose the most suitable chart for your data. You can also edit the chart’s basic properties and data variations easily.
Let’s have a closer look at how to add a chart to videos using VSDC.
Step 1: Install the Application
Go to the official website of VSDC (https://www.videosoftdev.com/) in your browser to install the application.
Step 2: Import Your Video
Launch the software and click the New project icon to upload your video.
Step 3: Add a Chart to Your Video
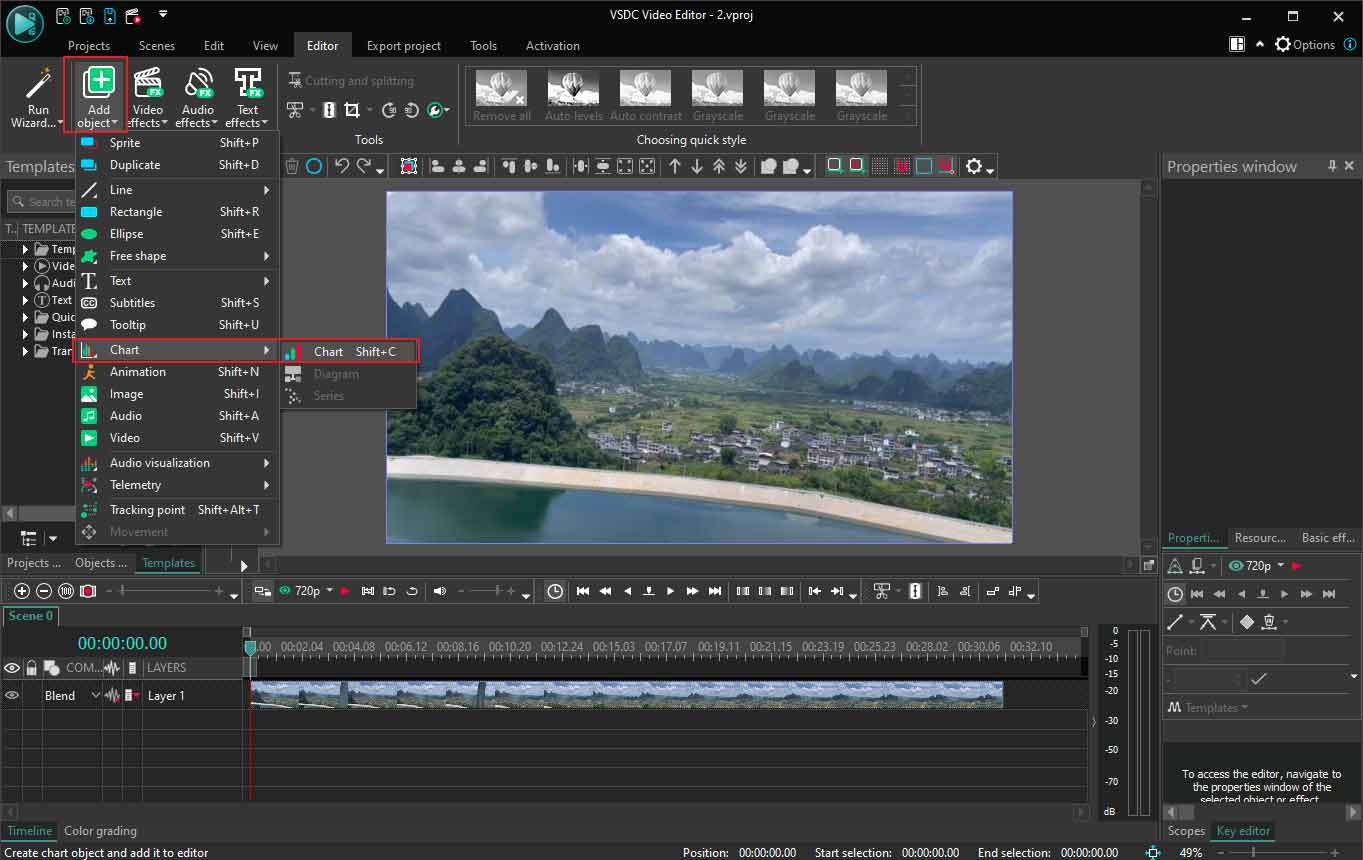
Click the Add object icon and choose Chart from its dropdown list. You can directly drag and resize the chart from the player window. Next, scroll down the properties window to customize the detailed information about the chart.
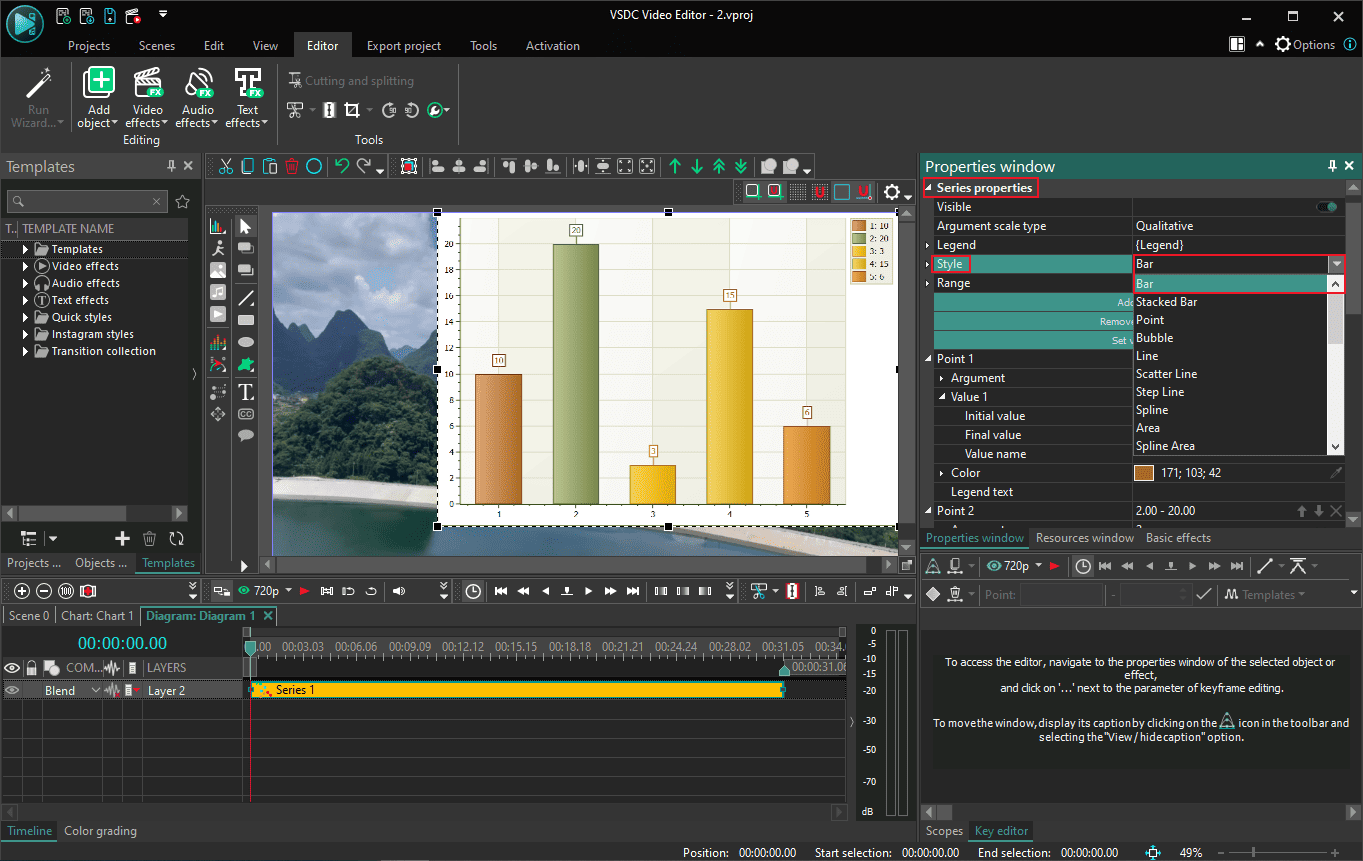
Select Style from the Series properties to choose your desired graph style.
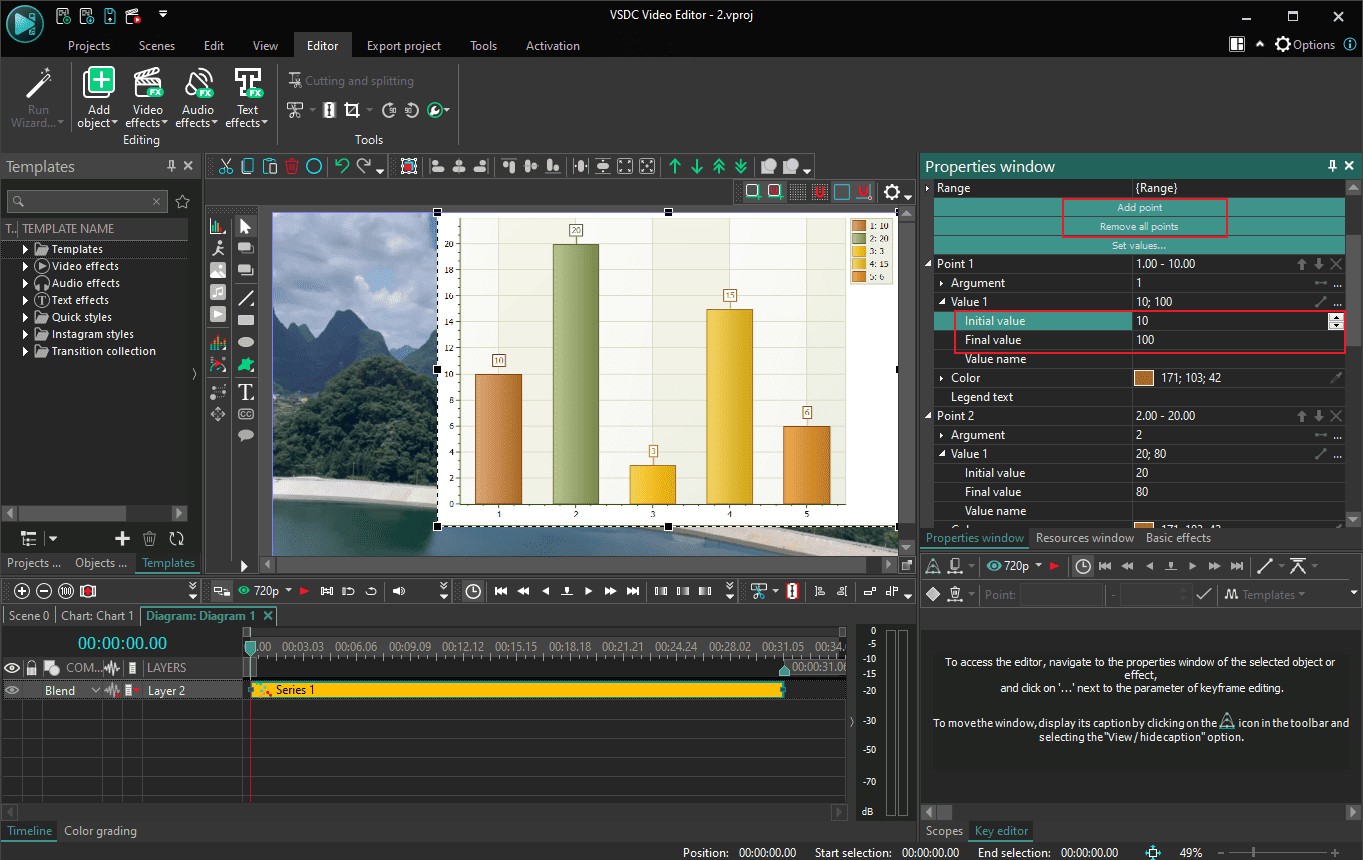
Then, click Remove all points and Add point one by one to enter the accurate values. If you want to show the variation of values, it is necessary to enter the initial and final values to make the graph move. Moreover, it also supports customizing the color of the chart and different points.
Step 4: Export the Final Video
After the editing is finished, click the Save project icon at the top toolbar to save the video to your computer.
How to Add a Chart to Videos Using Filmora
Filmora is another excellent graph video maker. As an AI-powered video editing software, it offers robust data visualization features that allow you to transform data into animated charts such as pie, bar, column, and more. What’s more, it provides extensive customization options, including theme modes, colors, fonts, and other settings, helping you tailor the visuals to specific needs.
In addition to chart creation, Filmora also excels in abundant video templates and powerful AI editing tools, such as voice enhancement. Furthermore, it also comes with a full suite of editing features like filters, transitions, and more to elevate your video.
How to add a chart to videos? Follow the guide.
Step 1: Install the Application
Navigate to the official website of Filmora in your browser. Alternatively, you can search for it on the Microsoft Store and download it.
Step 2: Import Your Video
Open this software and click New Project to access the main editing interface. Next, click Import Media to upload your video. Then, drag the video to the timeline.
Step 3: Add a Chart to the Video
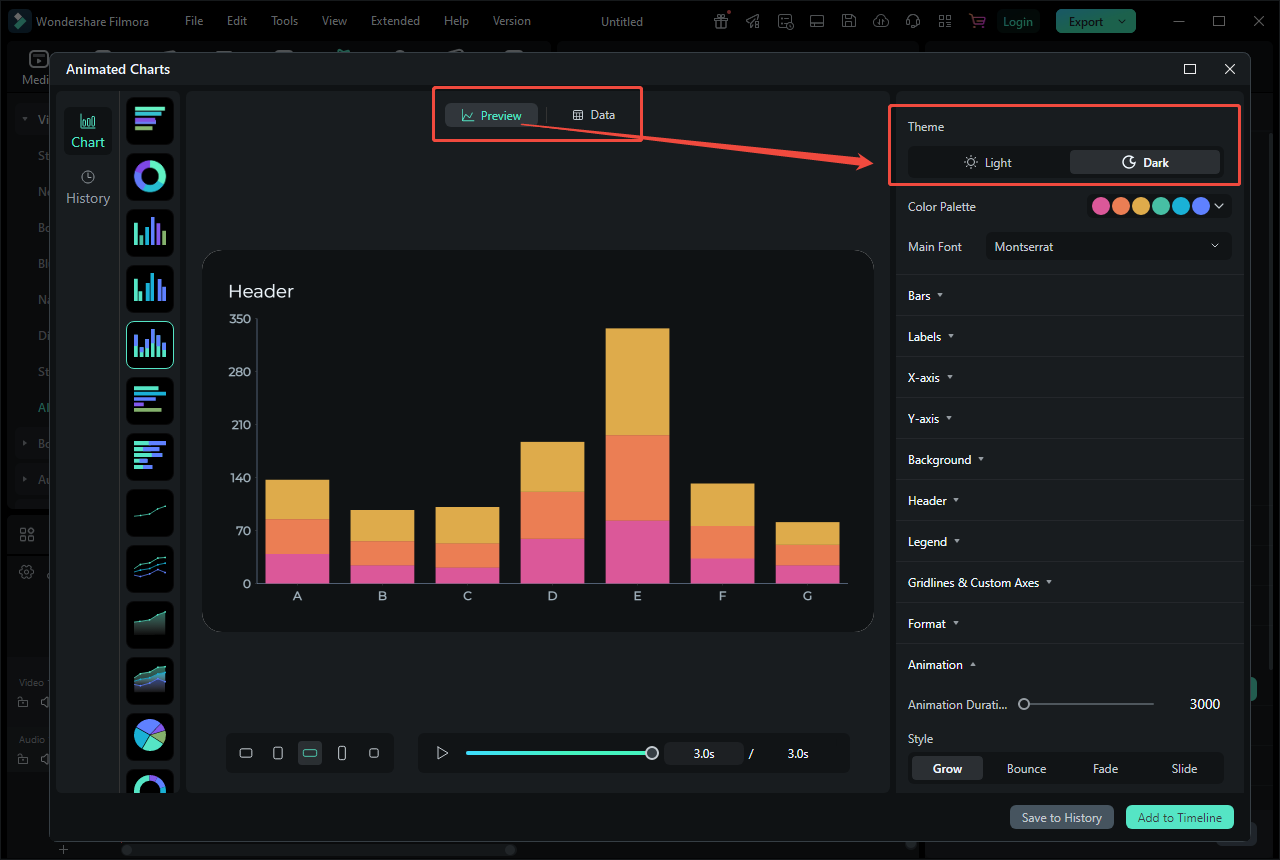
Click the Effects tab at the top toolbar and scroll down to select AI Infographic. Click the Animated Charts option to enter its editing window.
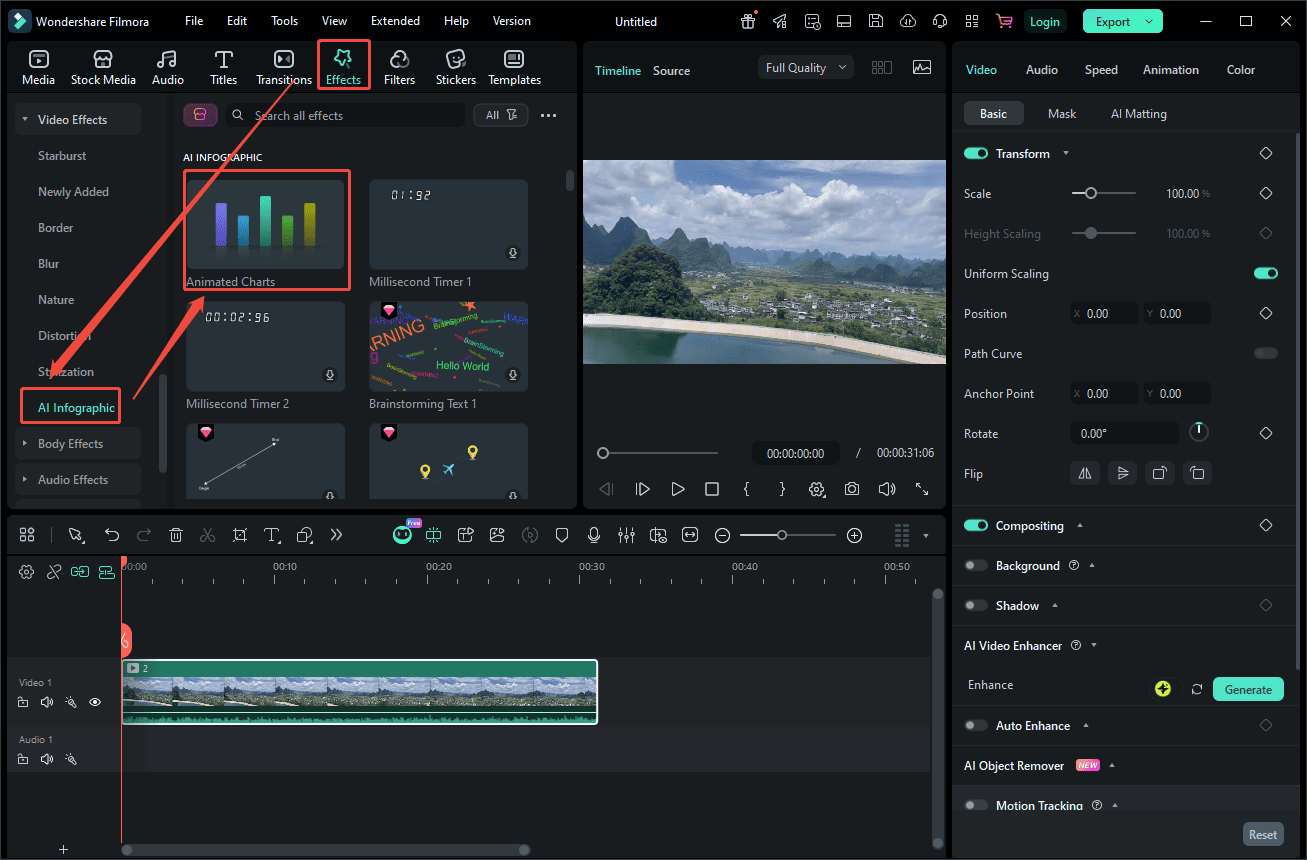
Then, pick a desired chart according to the animation and customize the basic properties and accurate values on the right panel. After setting, click Add to Timeline. Also, you can drag and resize the chart in the player section.
Step 4: Export the Final Video
Once everything is done, click Export at the top of the menu to save your final video.
Conclusion
This post gives a detailed tutorial on how to add a chart to videos using VSDC and Filmora. Regardless of which method suits your needs, both approaches can help you create animated charts in videos and elevate your content. Hope this article helps you a lot!
About The Author

Position: Columnist
Alice is a tech writer at MiniTool, specializing in tutorials and guides on video editing and screen recording. She stays up to date with the latest tools and techniques to ensure her content is accurate and easy to follow. By combining hands-on testing with continuous learning, Alice aims to help readers solve tech problems efficiently.
User Comments :